
Custom Reporting for Clio Manage
Email us for more info
Now more than 80 predefined reports !
- Data Sources
- Clio Manage Data direct import
- Standalone/Excel spreadsheet data import
- We can build custom integrations into ANY platform
- Build your own custom report
- Define your own custom reports, financial, budget, workflow, whatever you can think of
- Data Tables, Charts (Bar, Line, Area, Radar, Pie)
- Import/Export report definitions to share with other users
- Import data from Excel spreadsheets
- Export report data to Excel or CSV
- Organize reports in custom dashboards
- Build your own custom homepage with all your favorite reports
- Place, move and resize reports within a dashboard
- Add Dashboard(s) to your ReportZone landing page
- Video Tutorials
- New user tutorials
- Create reports and dashboards
- Advanced and expert user tutorials
- Supported Browsers
- Chrome (Preferred Browser)
- Microsoft Edge Version 84+
- Safari
- Firefox

Dashboards and Report
Providing insight into your data
Reports YOU need, they way YOU want them.
With ReportZone you can create you own custom reports with your choice of visualization. You are not bound to what is provided by the application. Our pre-defined report templates can also be changed in any way you like.
YOU decide what data you want to report against.
Pick your data, pick your report type (table, graph), and add the resulting template to your own custom dashboard.
Let ReportZone build reports for you for a modest fee.
- Unlimited Reports
- Unlimited Dashboards
- Many predefined report templates
- Create your own custom templates
Add Reports and Dashboards to top level Landing page view.
Services
For those clients who need help to define new reports we'll help you build them.

Custom Reports
Send us a report request and we'll build it for you.
Custom report definitions are charged by the hour @75 $US.
We will create reports for free if they do NOT include custom fields (with paid subscription).
Typically a report definition takes between 10-30 minutes to create, but complex reports may take longer.
Contact us for detailed quotes.
Click here to email usCustom Dashboards
Need help with setting up new dashboards ?
We can help with that too, though it is fairly simple to do yourself.
Just use our intuitive dashboard editor.
Customer value
ReportZone provides customer value by allowing users to create their own specialized reports.
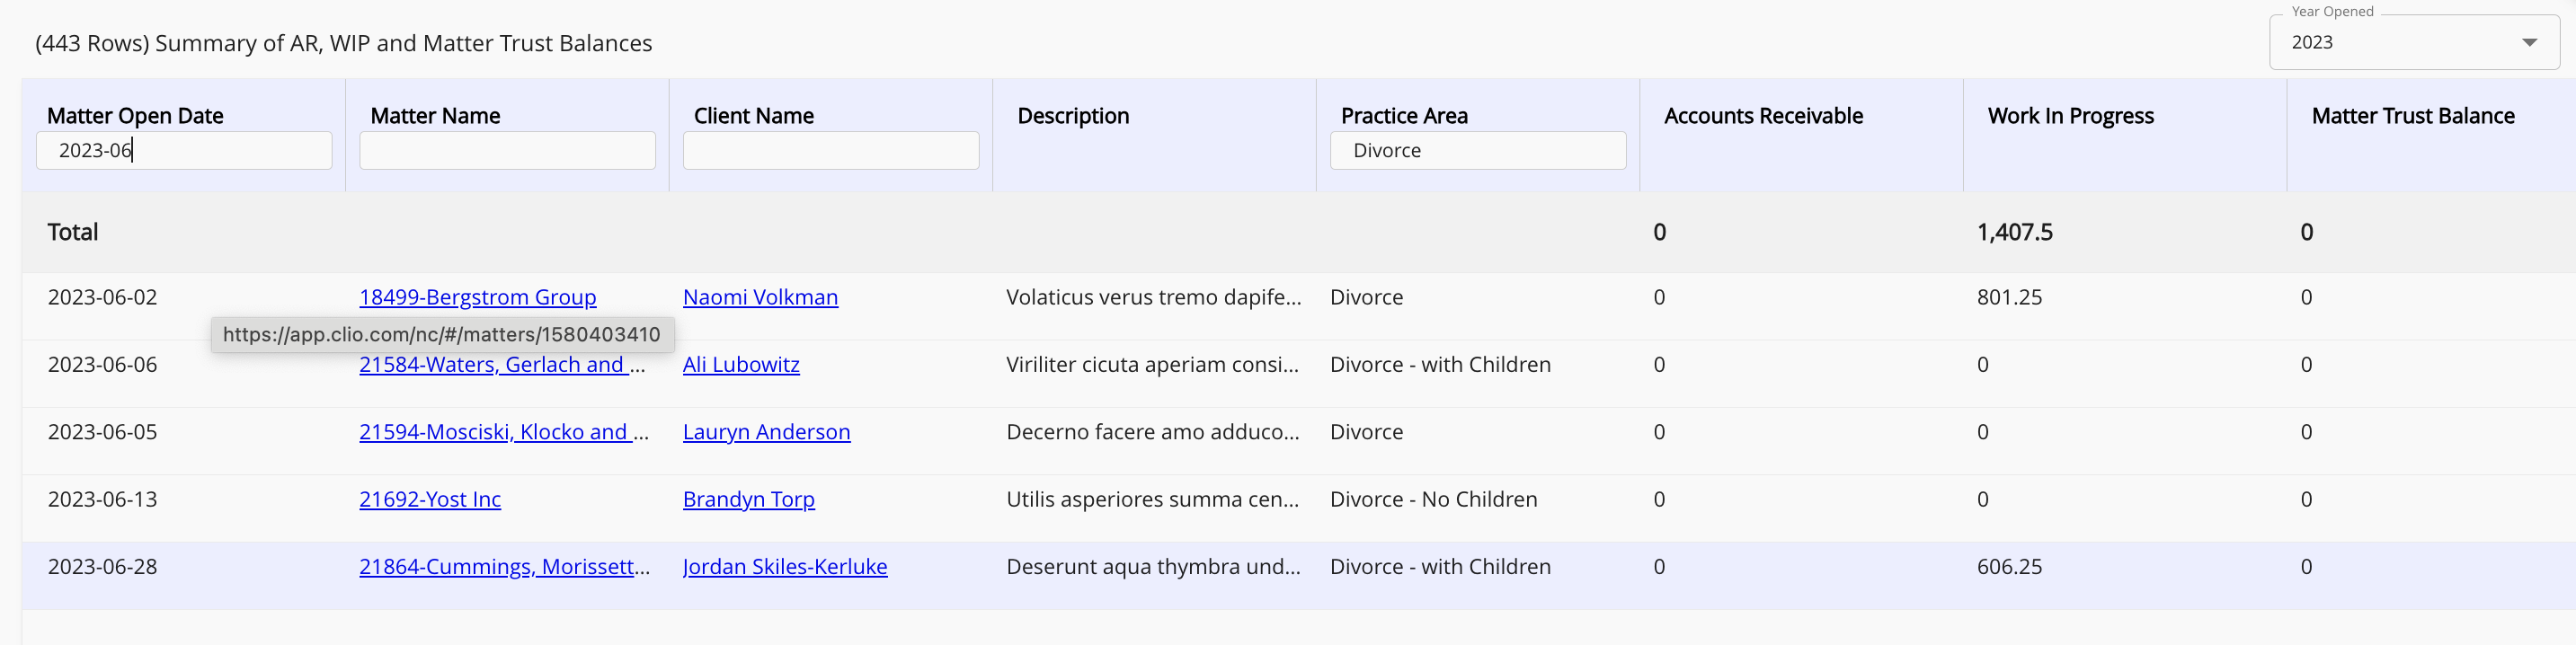
A ReportZone customer required a report that would allow them to view up to date information grouped by matter which had to include matter trust balances, accounts receivable, work in progress and can be searched by
- Matter open date
- Matter name (with url link to Clio matter)
- Client name (with url link to Clio client)
- Practice Area
and can be filtered by year.
The report also need to show totals for accconts receivable, matter trust balances and work in progress. These totals had to be dynamically updated when search and filters where applied.
The filtered report data can also be exports as CSV or Excel for further processing with external tools.
Custom reports are only limited by the data Clio Manage provides and by the customer's imagination/requirements.
Pricing and Licenses
To create an trial account, visit the Report Zone App and click on "Create Account".
Product support is available for annual subscriptions only. This can can used for custom reports and/or dashboards.
Available for ALL Clio customers in all Regions (CA,US,EU,AU) !
Pricing is in US$ for ALL regions !
Discounted pricing available for 5 or more licenses!
30 day Trial
No restrictions
- Create you own custom pages
- Predefined Reports
- Predefined Dashboards
- Create unlimited custom dashboards
- Create your own custom reports
- Import custom data from Excel
- Export Clio data as Excel or CSV
- Access to global report repository
Basic Plan
34.99 US$per user/month
419.88 US$
350.00 US$per user/year
- Create you own custom pages
- Predefined Reports
- Predefined Dashboards
- Create unlimited custom dashboards
- Create your own custom reports
- Import custom data from Excel
- Export Clio data as Excel or CSV
- Access to global report repository
- 3 hrs for custom report definitions (annual subscription only)
- Cost for additional custom reports is 75$US/hr
Frequently Asked Questions
-
Where is my client data stored ?
ReportZone downloads your client data onto your own device.
The first time you sign in it will take a significant amount of time (depending on the amount of data stored in Clio Manage)to load all the data. ReportZone allows you to limit the amount of data loaded by specifying a load after date in the user preferences.
Individual report data can also be reloaded, e.g. if a report uses matters and bills the user can force a reload of just those data tables.
After the initial load all data is stored in IndexedDB on your workstation (IndexedDB is a web standard for storing large amounts of data locally and is supported by all major Browsers). On all subsequent reloading, data is only refreshed/updated after a certain threshold (default 4hrs since last load) has passed, however this can be overridden in the user preferences.
You also have the option of purging all data from your local workstation at any time
You can find our training videos in our ReportZone Youtube Video Channel -
How do you request a new report?
Just sent us an email at report.zone.contact@gmail.com